NodalArc is an open-source satellite network emulation platform. The source code is public at github.com/dotchance/nodalarc. NodalArc turns orbital motion into the lab environment itself. Links, latency, reachability, and ground access change because the bodies moved. LEO constellations are the first proving ground because that is where the industry argument is loudest. The model is built to grow outward: MEO, GEO relays, Earth-Moon paths, lunar surface links, Lagrange stations, Mars relay, and deep-space corridors.
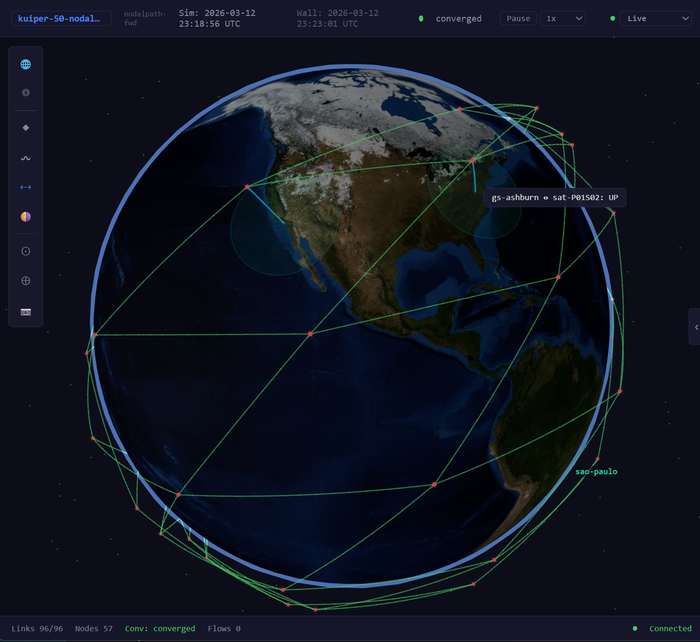
The first useful case is a familiar one: satellites in low Earth orbit, crosslinks coming and going, ground stations handing off as the sky passes overhead. That is not the limit of the idea. It is the place where the argument can start with numbers instead of adjectives. post 002 (Addressing the Geometry Problem) walks through the geometry primitives behind that claim.
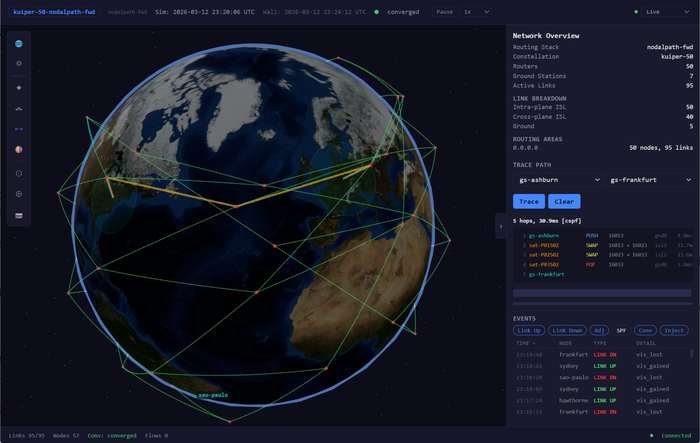
A lab that cannot tell you what happened is just a demo. Path traces, convergence events, substrate timing, session state, and topology history all have to be visible enough that a run can be repeated and argued about. post 005 (The Lab Is a Network) explains why the lab's own latency has to be measured and subtracted before any result is worth defending.
Architecture
NodalArc is not a diagram wrapped around a routing demo. It is a set of boundaries. The sky computes motion. The scheduler turns motion into link intent. The node substrate makes the system obey. The session layer keeps the experiment repeatable. The lab interface lets a human inspect the moving network without pretending the motion is decorative.
Orbital mechanics. Computes motion, visibility, range, and latency. This is the source of truth. If the geometry says two nodes cannot see each other, the network does not get to vote. post 003 (The Future Is Computable) covers what that truth looks like as events.
Topology scheduler. Turns orbital state into intended link state. Links come up, links go down, latency changes, and the scheduler keeps that motion ordered enough for the rest of the system to act on it. post 004 (Between the Sky and the Kernel) walks the boundary between the scheduler and the kernel.
Node substrate. Makes the intended topology real enough for routing behavior to react. Carrier state, interface shape, latency, bandwidth, and reachability are not chart decorations. They are the experiment.
Session layer. Composes satellite types, constellation geometry, ground stations, routing models, placement, and time controls into a repeatable run. Change one primitive, run again, and you have an experiment instead of a story. post 006 (One Idea Per File) shows the file layout; post 007 (The Session Builder) covers the browser workflow that builds the same session without making you write YAML by hand.
Lab interface. The browser is the working surface. Build a session, preview coverage, watch the globe, switch to the topology, inspect a node, trace a path, pause time, and open a terminal when the abstraction starts lying.
External path engines. NodalArc is the substrate. It can run ordinary distributed routing, or it can let a system like NodalPath compute forwarding from the orbital timeline and push state ahead of the geometry.
NodalPath — the proactive-routing engine that runs on top of NodalArc, computing forwarding state from the orbital timeline ahead of the geometry rather than reacting after it. post 009 (Forwarding Ahead of the Geometry) covers the architectural split.